There is no shortage of articles explaining the difference between hot aisle containment and cold aisle containment. The basic mechanics are well covered: cold aisle containment seals the cold supply air in, hot aisle containment captures the hot exhaust air. Both prevent mixing. Both improve cooling efficiency.
What these articles almost never cover is the financial side. How much does each approach actually cost to install? How long does the payback take? What measurable improvement can you expect in PUE, and what does that translate to in energy savings per year?
These are the questions Marcus asks when he writes a business case. And these are the questions most vendor content avoids, because the answers depend on facility-specific variables that cannot be reduced to a single number.
This post provides the framework, the cost ranges, and the calculation methodology that operations managers need to build a containment business case with real numbers.
The Cost Components (That Vendors Leave Out)
When a containment vendor quotes a project, the number typically covers materials: panels, doors, curtains, or rigid enclosures. That number is real, but it is not the full cost.
The full cost of a containment deployment includes:
Materials. The physical containment system itself. Rigid panel systems cost more than curtain-based systems but last longer and seal better. Costs vary widely depending on the number of racks, aisle width, ceiling height, and whether the deployment is a retrofit or a new build.
Engineering and design. Someone needs to survey the aisle, model the airflow, specify the components, and create the installation plan. For retrofit projects in live data centres, this is not trivial. The engineering phase may require CFD (computational fluid dynamics) modeling to predict the thermal impact and verify that the cooling system can handle the changed airflow pattern.
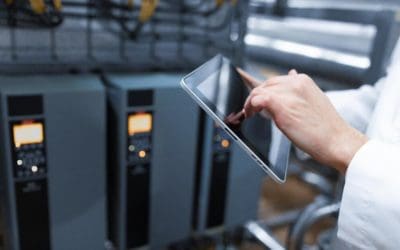
Installation labour. Containment installation in a live facility requires working around active equipment. Depending on facility policies, this may require scheduled maintenance windows, change management approvals, and supervision by facility staff. Labour rates vary by region and facility access requirements.
Cooling system adjustments. This is the cost that gets missed most often. Containment changes the pressure dynamics in the data hall. CRAC/CRAH units may need fan speed adjustments, temperature setpoint changes, or repositioning to work effectively with the new airflow pattern. In some cases, variable frequency drives (VFDs) need recalibration. If the cooling system is not adjusted after containment installation, the energy savings will be smaller than projected.
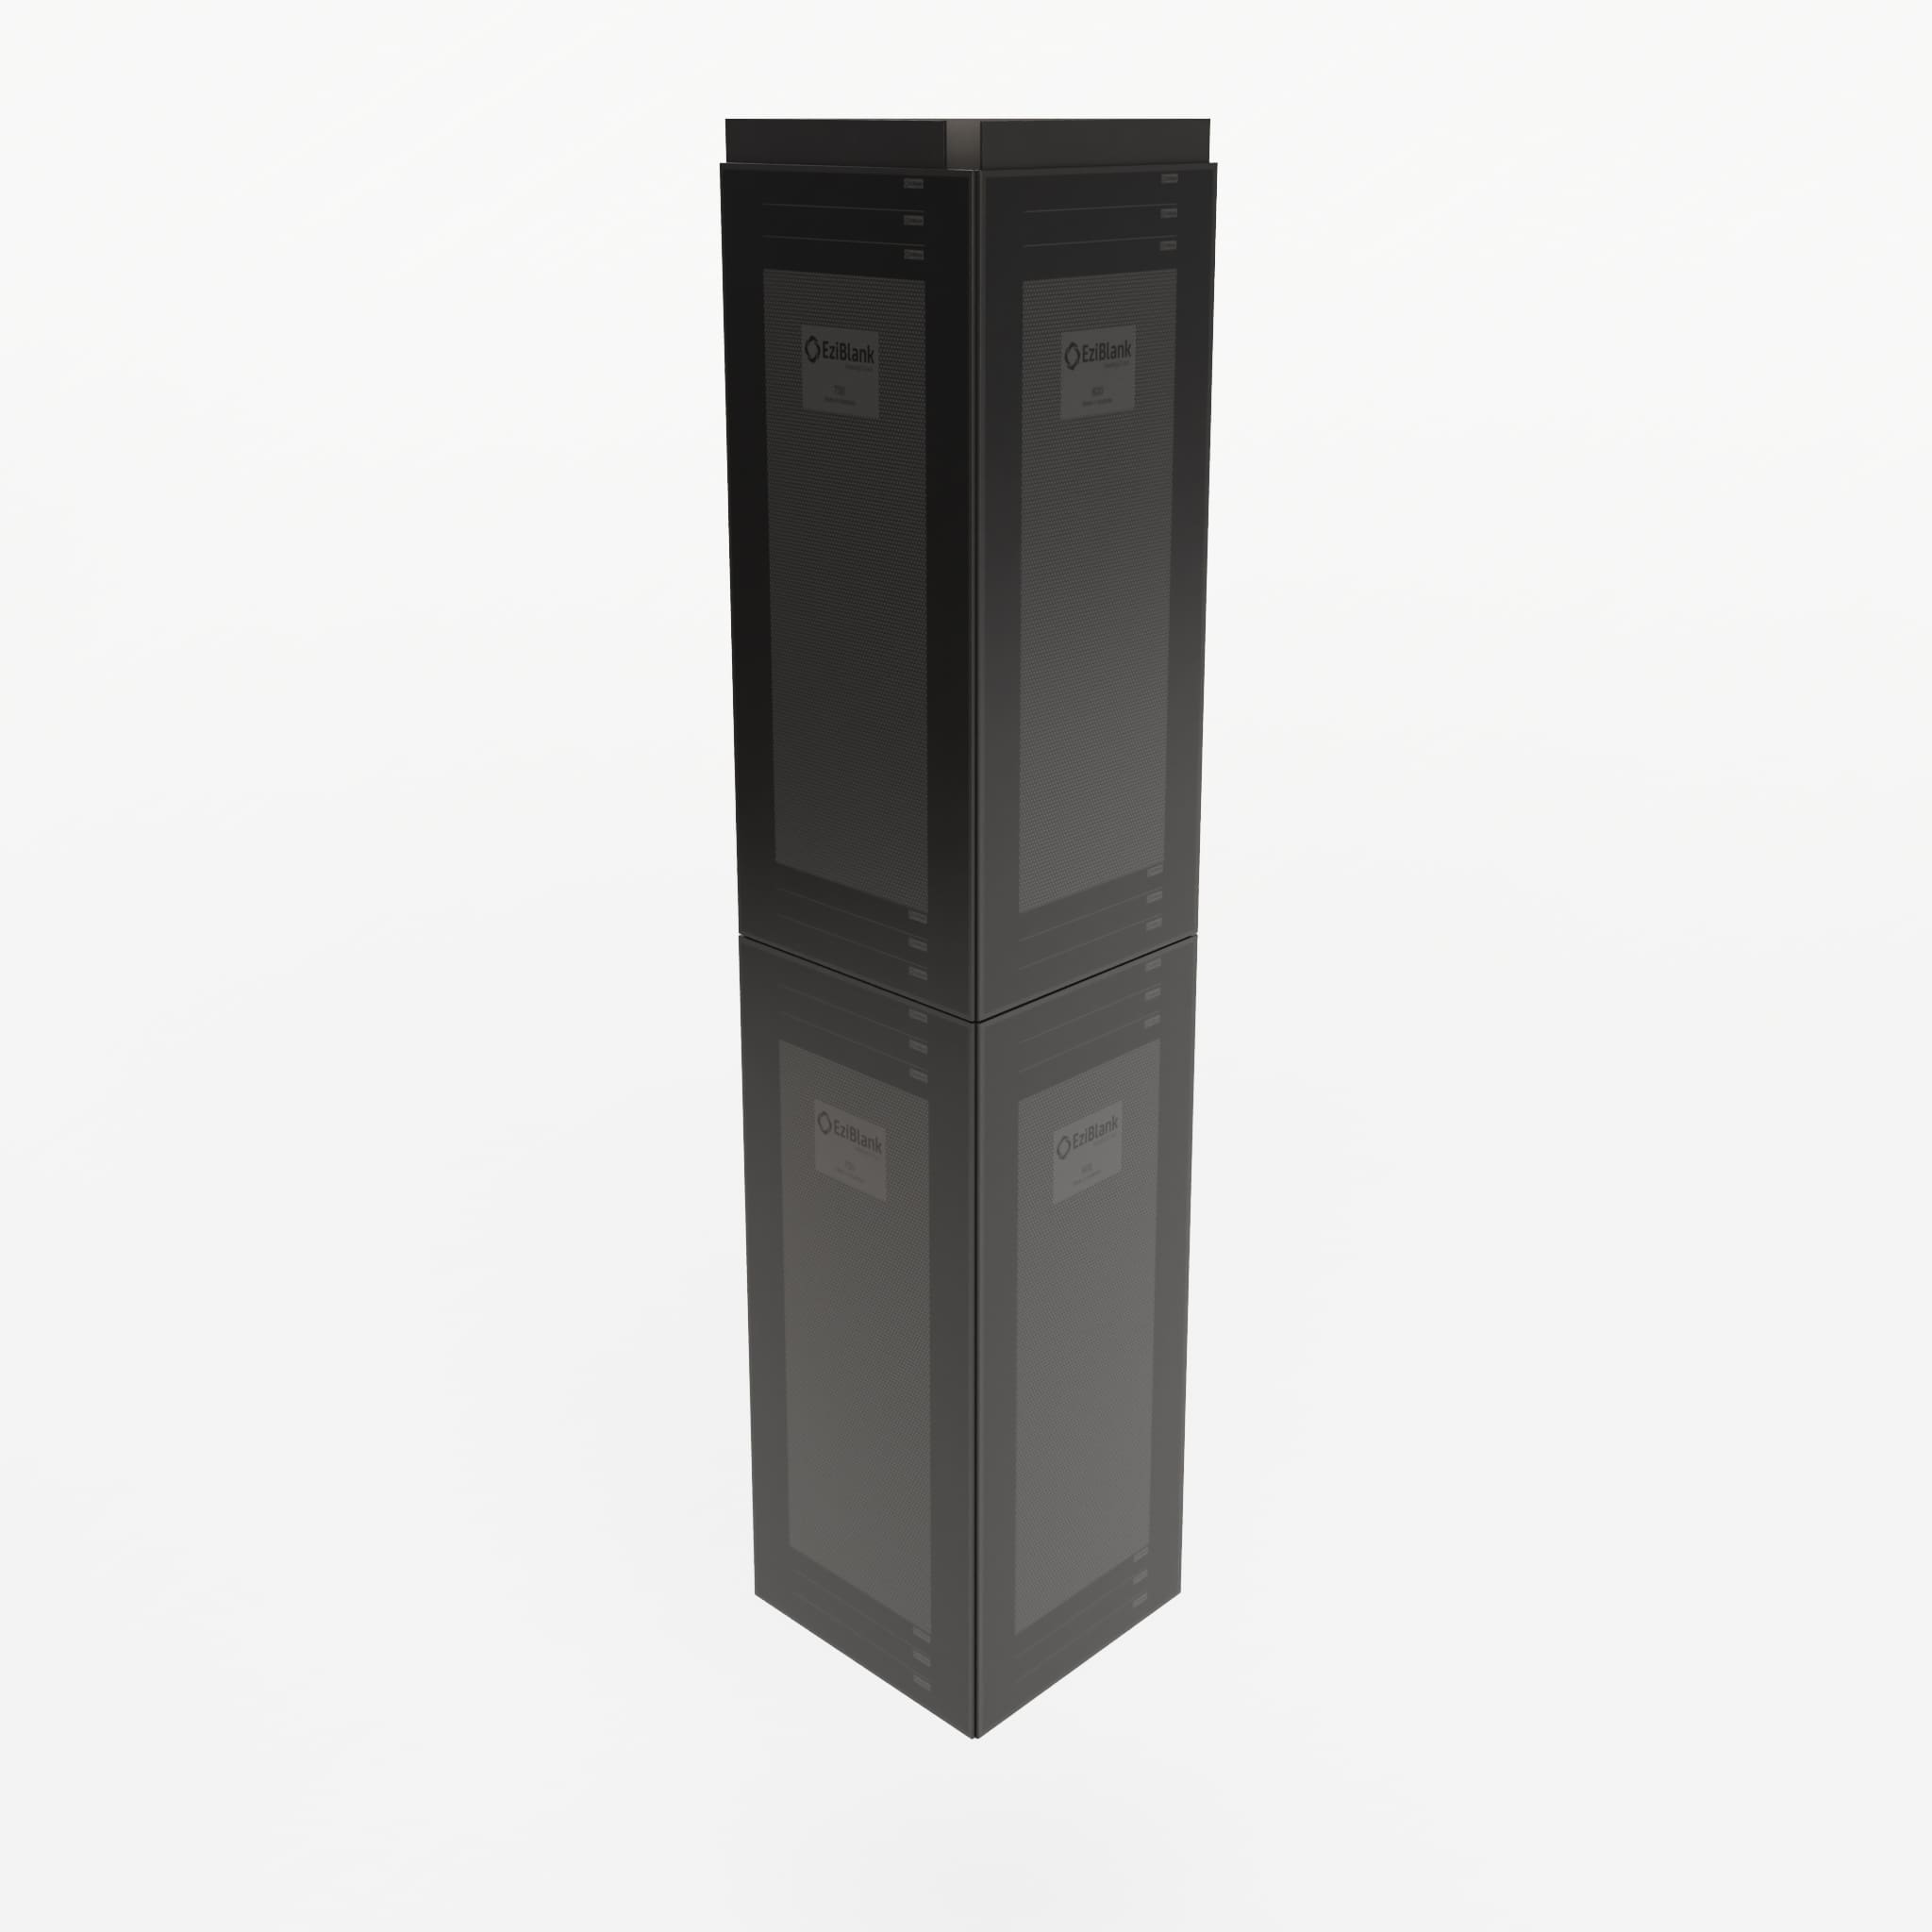
Blanking panels and sealing. Containment only works if the racks within the contained aisle are properly sealed. Every open rack unit within the containment zone needs a blanking panel to prevent bypass airflow from undermining the containment investment. If your racks are not fully sealed before containment goes in, budget for blanking panels as part of the project cost.
Fire suppression review. In many jurisdictions, adding physical barriers (containment walls, doors, or roof panels) to a data hall triggers a fire suppression review. The suppression system was designed for an open floor plan. Containment creates enclosed volumes that may affect suppression agent distribution. A fire engineer may need to verify or modify the system. This cost is often discovered late in the project.
Cost Ranges: What the Market Looks Like
Exact pricing varies by vendor, region, and project complexity. The ranges below reflect typical installed costs (materials plus labour, excluding engineering and fire suppression review) for retrofit projects in existing facilities.
Curtain-based containment (cold or hot aisle): The lowest capital cost option. Strip curtains or solid vinyl panels mounted on a frame above the aisle. Good for facilities that need a fast, budget-friendly deployment. Typical installed cost ranges from low to mid hundreds of dollars per rack, depending on aisle length and ceiling complexity.
Rigid panel containment (cold or hot aisle): Polycarbonate, acrylic, or metal panels in a structural frame. Better sealing, longer lifespan, more professional appearance. Typical installed cost ranges from mid hundreds to over a thousand dollars per rack. Custom configurations (non-standard aisle widths, irregular ceiling heights, overhead cable tray integration) push costs higher.
Modular containment systems: Pre-engineered systems designed for fast installation and reconfiguration. EziBlank’s containment solutions fall into this category. Modular systems balance cost and flexibility, making them well-suited for facilities where the rack layout may change over the containment system’s lifespan.
Measuring the Return: PUE Before and After
The return on a containment investment is measured primarily through PUE improvement.
PUE (Power Usage Effectiveness) compares total facility power to IT equipment power. A PUE of 2.0 means the facility uses twice as much power as the IT equipment alone, with the other half going to cooling, lighting, and overhead. A PUE of 1.4 means overhead is 40% of IT power.
Containment typically improves PUE by reducing cooling energy consumption. When hot and cold air no longer mix, the cooling system can deliver higher-temperature supply air (because it arrives at the server inlets without being diluted by hot exhaust). Higher supply temperatures mean the cooling system works less hard, which means lower energy consumption.
The Calculation Framework
Here is the simplified framework for calculating containment ROI:
Step 1: Measure current PUE. Use your building management system (BMS) or power monitoring data to calculate your current annualized PUE. If you do not have this data, start measuring before you invest in containment. You cannot calculate ROI without a baseline.
Step 2: Estimate PUE improvement. Industry data from the Uptime Institute, Green Grid, and published case studies suggests containment typically reduces PUE by 0.1 to 0.3 points, depending on the starting PUE and the completeness of the containment deployment. Facilities starting with poor airflow management (PUE above 1.8) tend to see larger improvements. Facilities already running efficiently (PUE below 1.4) see smaller gains.
Step 3: Calculate annual energy savings. Multiply your total IT load (in kW) by the PUE difference, then multiply by your electricity cost per kWh, then multiply by 8,760 (hours per year).
Example: A facility with 500 kW of IT load, a current PUE of 1.7, and an estimated post-containment PUE of 1.5 saves 0.2 x 500 kW = 100 kW of continuous cooling energy. At $0.12/kWh, that is 100 x 8,760 x $0.12 = approximately $105,000 per year.
Step 4: Divide total project cost by annual savings. If the containment project costs $150,000 installed (including blanking panels, engineering, and fire review), the simple payback is $150,000 / $105,000 = approximately 1.4 years.
Use the EziBlank ROI calculator to run this calculation with your facility’s actual numbers.
Why the Range Is So Wide
The reason vendors avoid publishing specific ROI figures is that the variables change everything:
- Electricity cost varies from $0.05/kWh in some US markets to over $0.30/kWh in parts of Europe and Australia. This single variable can triple the payback period or cut it to months.
- Starting PUE determines how much room there is for improvement. A facility at PUE 2.0 has more fat to cut than one at PUE 1.3.
- Completeness of deployment matters enormously. Containing one aisle in a 20-aisle data hall produces a smaller facility-level PUE change than containing all 20. Partial deployments have proportionally longer payback periods.
- Rack sealing is the hidden variable. Containment with unsealed racks can deliver as little as half the expected improvement, because bypass airflow within the contained zone undermines the thermal separation.
Hot Aisle vs Cold Aisle: The Financial Difference
From a pure cost perspective, hot aisle and cold aisle containment are similar. The materials and labour are comparable. The financial difference shows up in operational impact.
Cold aisle containment is generally easier to implement because it works with existing CRAC/CRAH unit positioning (most units are positioned to deliver air to the cold aisle). It is also more comfortable for technicians, since the working aisle (where they stand in front of racks) stays cool.
Hot aisle containment captures exhaust heat more efficiently and returns higher-temperature air to the cooling units, which can improve cooling system efficiency (especially for units with economizer modes). However, it makes the hot aisle uncomfortable for extended work, which can affect maintenance workflows.
The ROI calculation is the same for both. The choice between hot and cold aisle containment depends more on facility layout, cooling system type, and operational preferences than on financial return.
Building the Business Case
Marcus does not need a perfect number. He needs a defensible range. Here is a template for the one-page business case:
Problem: Current PUE of [X] indicates [Y]% of facility power goes to non-IT overhead, primarily cooling. Airflow mixing between hot and cold aisles forces cooling systems to overcool the supply air to compensate.
Solution: Deploy [hot/cold] aisle containment across [number] aisles ([number] racks). Include blanking panel remediation for unsealed racks within contained aisles.
Investment: $[range] including materials, engineering, installation, blanking panels, and fire suppression review.
Return: Estimated PUE improvement of [0.1 to 0.3], resulting in annual energy savings of [range]basedon[kWITload]and[X/kWh electricity cost].
Payback: [range] years at current energy pricing. Payback shortens if energy prices increase.
Risk: Minimal operational disruption. Installation can be phased by aisle during scheduled maintenance windows.
The Numbers Are There. Use Them.
The data centre industry has enough published benchmarks, case studies, and engineering references to build a solid containment business case. The reason most business cases stall is not lack of data. It is that nobody sits down and runs the numbers for their specific facility.
If you have your PUE, your IT load, and your electricity cost, you have everything you need to calculate whether containment pays for itself. In most facilities operating above PUE 1.5, it does, and often within two years.
Contact EziBlank to scope a containment project for your facility.